shinken 1.2.4 on ubuntu desktop 12.10 iii
15 mar 2013
motivation
in this posting i want to enhance the shinken usage with a few new ideas
adding check_ping to hosts
there are two ways:
one adds it to the template.cfg in the generic-host record
 # Generic host definition template - This is NOT a real host, just a template!
 # Most hosts should inherit from this one
 define host{
         name                            generic-host

         # Checking part
         # no check_command by default. check each 5 min when all is OK/UP
         # and make 3 checks (one bad then 2 others) for going HARD and so
         # raise notifications
         max_check_attempts              2
         check_interval                  5

         # Check every time
         active_checks_enabled           1
         check_period                    24x7

         # Notification part
         # One notification each day (1440 = 60min* 24h)
         # every time, and for all 'errors'
         # notify the admins contactgroups by default
         contact_groups                  admins
         notification_interval           1440
         notification_period             24x7
         notification_options            d,u,r,f
         notifications_enabled           1

         # Advanced option. Look at the wiki for more informations
         event_handler_enabled           0
         flap_detection_enabled          1
         process_perf_data               1

         # Maintenance period
         #maintenance_period             workhours

         # Dispatching
         #poller_tag                      DMZ
         #realm                           All

         # For the WebUI
         #icon_set                        server ; can be database, disk, network_service, server

         # This said that it's a template
         register                        0
         check_command                  check_ping
 }
note: some hosts might respond to ping because it is disabled, thus your results are STATE_CRITICAL so it might be a better idea to add it per host.
one adds it per service or host entry, see [1] for service example:
 define host{
 host_name                      serverkommune.de
 hostgroups                     joachim
 contact_groups                 admins
 address                        serverkommune.de
 check_command                  check_ping
 use                            http
 }
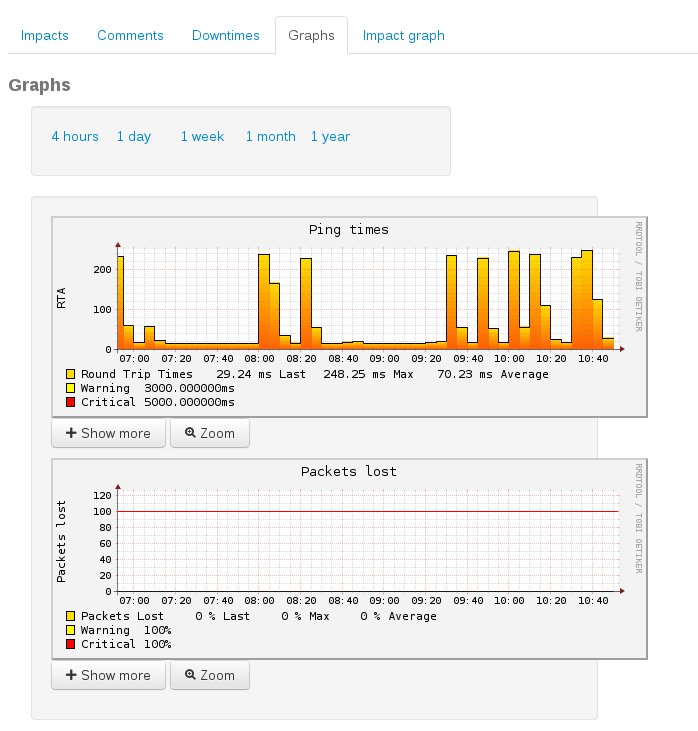
looks like:
how to write a custom test which generates a RRD graph -> perfdata
see [2] and [3]
specification
the right structure is :
what_you_want_to | variable1=value;warning_threshold;critical_threshold;min;max, variable2=value;;warning_threshold;critical_threshold;min;max- min and max can be empty
here is the modified example from the last blog posting about shinken:
#! /bin/bash
#
# js@lastlog.de
# 05/03/2013
#
#  This Nagios test plugin was created to demonstrate how it is integrated into shinken
#  now with perfdata creation
#

PROGNAME=`basename $0`
PROGPATH=`echo $0 | sed -e 's,[\\/][^\\/][^\\/]*$,,'`
REVISION="0.0.1"

. $PROGPATH/utils.sh

print_usage() {
  echo "Usage:"
  echo "  $PROGNAME --help"
  echo "  $PROGNAME --test"
  echo "  $PROGNAME --version"
}

print_help() {
  print_revision $PROGNAME $REVISION
  echo ""
  print_usage
  echo ""
  echo "Nagios test plugin"
  echo ""
  echo "--test"
  echo "   Perform a test; in this implementation it either returns: STATE_OK STATE_CRITICAL STATE_UNKNOWN "
  echo "--help"
  echo "   Print this help screen"
  echo "--version"
  echo "   Print version and license information"
  echo ""
  support
}

# Information options
case "$1" in
--help)
                print_help
    exit $STATE_OK
    ;;
-h)
                print_help
    exit $STATE_OK
    ;;
--version)
                print_revision $PROGNAME $REVISION
    exit $STATE_OK
    ;;
-V)
                print_revision $PROGNAME $REVISION
    exit $STATE_OK
    ;;
--test)
    # STATE_OK
    # STATE_WARNING
    # STATE_CRITICAL
    # STATE_UNKNOWN
    # STATE_DEPENDENT
    # $(($RANDOM%3))
    f=$(($RANDOM%9))
    l=$(($RANDOM%9))

    case $(($RANDOM%5)) in
      0)
# ping=2;50;100;; lost=0;5;10;;"

          echo "STATE_OK - $(date) | ping=$f;50;100;; lost=$l;5;10;;"
          exit $STATE_OK
      ;;
      1)
          echo "STATE_WARNING - $(date) | ping=$f;50;100;; lost=$l;5;10;;"
          exit $STATE_WARNING
      ;;
      2)
          echo "STATE_CRITICAL - $(date) | ping=$f;50;100;; lost=$l;5;10;;"
          exit $STATE_CRITICAL
      ;;
      3)
          echo "STATE_DEPENDENT - $(date) | ping=$f;50;100;; lost=$l;5;10;;"
          exit $STATE_DEPENDENT
      ;;
      *)
          echo "STATE_UNKNOWN - $(date) | ping=$f;50;100;; lost=$l;5;10;;"
          exit $STATE_UNKNOWN
      ;;
    esac
    ;;
*)
    print_usage
    exit $STATE_UNKNOWN
esac
example 1
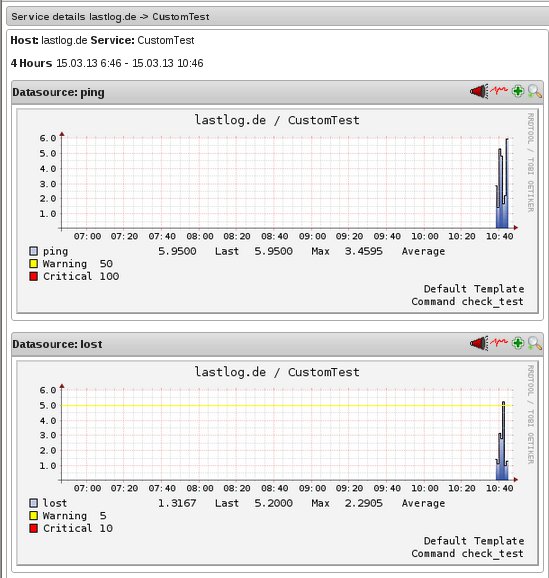
echo "STATE_OK - PING = 2ms & LOST = 0 packets | ping=2;50;100;; lost=0;5;10;;"the output looks like this:
example 2
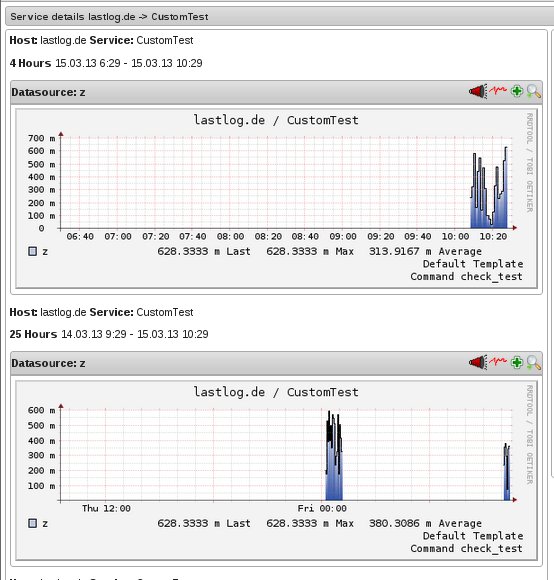
echo "STATE_OK - $(date) | z=0.$f"the output looks like this:
thanks
thanks to Issif and hufman from shinken#irc.freenode.org for explaining me the concept behind custom perfdata generation as shown in the examples!
links
- [1] http://docs.icinga.org/latest/de/macros.html
- [2] http://www.shinken-monitoring.org/wiki/official/advancedtopics-perfdata#plugin_performance_data
- [3] http://nagiosplug.sourceforge.net/developer-guidelines.html#AEN201
- [4] http://www.nagios-wiki.de/nagios/howtos/nagiosgrapher
- [5] http://www.shinken-monitoring.org/wiki/official/advancedtopics-perfdata#plugin_performance_data


